Use case - Detail Charge Export
Using Detail Charge Exports for targeted profiles
Objective
The objective behind this analysis strategy is to discover differences in patient outcomes resulting from specific treatments. The specific charges or services used to separate the subgroups are not easily located within large populations, so we use the Clinical Analytics Detail Charge Export function to help in this analysis.
Overview
Fundamentally, this analysis is similar to comparing similar patients across different attending physicians or different care sites, but this method requires more preparation because of intensive data mining.
This process requires us to:
- Find a group of similar patients (such as Knee Replacement).
- Split this group into smaller groups that received specific charges or services (Patients who received knee A vs patients who received knee B).
- Compare the patient populations with measures (for example, Total Costs or Pharmacy Costs) to determine whether the differing services impacted the quality of care.
Instructions
Before getting into Clinical Analytics, you must identify a target drug, procedure, or practice that you would like to know more about.
NOTE: This example uses the following hypothesis: "Patients who receive a hip replacement have different outcomes (LOS, cost) when receiving the drug Ephedrine during their hip replacement than patients who did not receive the drug Ephedrine during their hip replacement."
- First, let's build a scorecard that is usable in the future for this type of analysis. See Customize scorecards for more information.
- From Scorecards home, open the Hospital Scorecard template, and click the pencil icon in the top right corner. If you do not have the Hospital Scorecard template, you can use another Scorecard template.
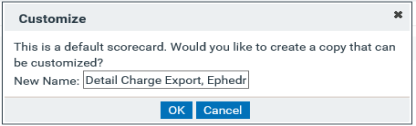
- You are prompted to create a custom version of the Hospital scorecard. Rename this custom scorecard (for example, "Detail Charge Export, Ephedrine Analysis"), and select OK.
- You are now in Customizer mode for your newly-created custom scorecard. Delete all the tabs from this scorecard by clicking the trash can icon for each tab.

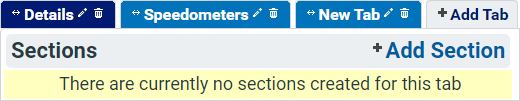
- Add back two new tabs by clicking the Add Tab icon.

- Rename your two tabs, Details and Speedometers. To do this, select the pencil icon on each tab and enter the new tab name.
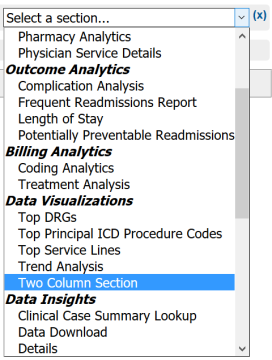
- Add a Details section in to your Details tab, and a Two Column section in your Speedometers tab. Click +Add section icon on the desired tab and select the desired section from the dropdown.
- Exit Customizer mode by clicking the green check mark in the top right corner of your screen.
NOTE: You cannot have a scorecard with less than one tab; you must add at least one tab before deleting the last of the existing tabs.
- Now that we have the scorecard sections we need, we want to isolate our patients of interest (Knee replacements) before creating further sub-groupings. See Profiles for more information.
- Click the Profile Manager icon in the upper right corner of your screen.

- Click +Add Profile to open the Profile Customizer for a new profile.

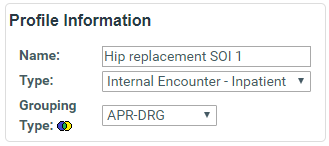
- Name the profile "Hip Replacement SOI 1" and make sure the Type is "Internal Encounter - Inpatient" with your preferred Grouping Type (we recommend APR-DRG).
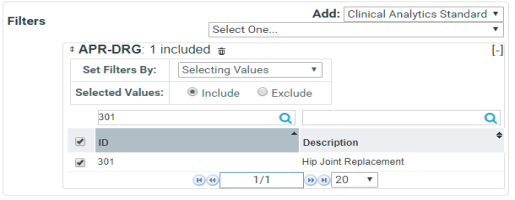
- Add filters for APR-DRG 301 and for SOI of 1.
- Click the Add Filter dropdown, and select APR-DRG. Check the box next to 301.
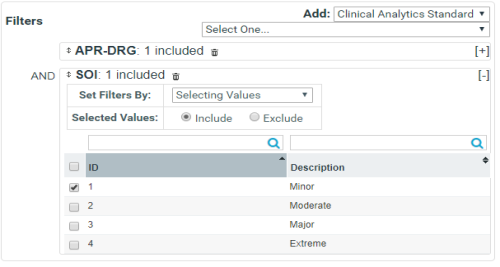
- Click the Add Filter dropdown, and select SOI. Check the box next to 1.
Click Save in the bottom right corner to return to the Profile Manager, and then click the green check mark in the upper right corner to return to your scorecard.
- Click the Profile Manager icon in the upper right corner of your screen.
- Unlock Clinical Analytics to access patient-level data. See Encryption and unlocking for more details.
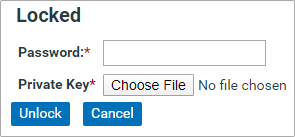
- Click the lock icon in the upper right corner.

- Enter your encryption password and select your encryption key file. Click Unlock.
- Click the lock icon in the upper right corner.
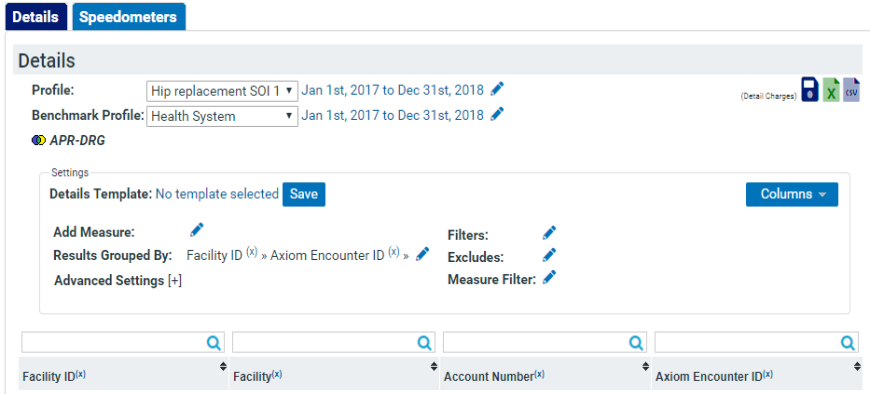
- On the Details tab, click the Profile dropdown, and select the new profile: Hip replacement SOI 1. Select the time period for the discharges you are interested in.
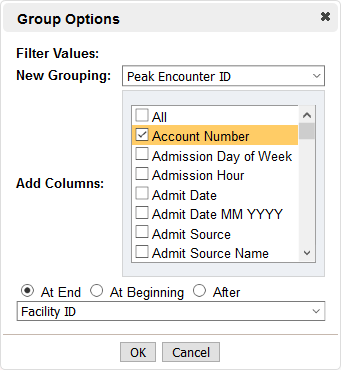
- Add a group-by for Axiom Encounter ID by clicking Add next to Results Grouped By.
- When the Group Options box appears, also select the check box next to Account Number (we need this later in our analysis).
- Click OK to close the Group Options box, and then click Rerun to repopulate the data table.
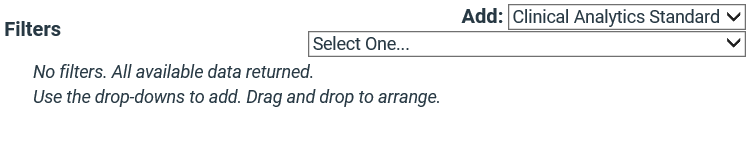
- If you want to change the columns of your table, you can click Columns in the top right corner of the Settings box to add or remove columns.
-
We now want to export all data from each patient by selecting the Detail Charges Export icon. This blue floppy disc icon is to the left of the green Excel export icon and downloads an Excel file.
- Open the newly downloaded Excel file. We now want to add filters to identify patients of interest (for example, encounters with a charge for Ephedrine).
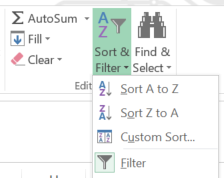
- In Excel, click the File tab along the top, then look for the Sort and Filter button along the ribbon. Click the Filter option; dropdown arrows appear next to each column header in your file.
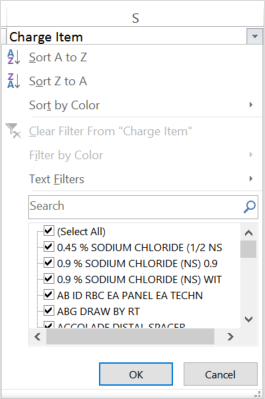
- In the column header labeled Charge Item, click the caret to add a filter to the data based on that column. This lists the information or names of each specific charge item depending on what you are searching for this could be a drug, a room charge, or even a specific supply item.
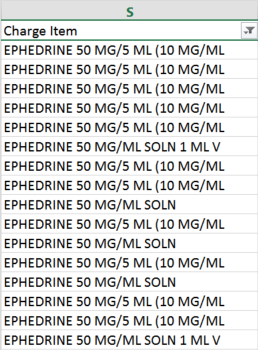
- For this example, clear all data by clearing the (Select All) box at the top of the list, and then enter “Ephedrine” in the search bar. After selecting the desired charges, click OK and your data is filtered. Notice that all of the charge item names have ephedrine listed.
- With the data still filtered by charge item, highlight and copy the entire list of available account numbers (the second column).
- Now that the data has been filtered to include only charge items with the name Ephedrine, we extract the list of patient account numbers and create a profile in Clinical Analytics containing all and only these patient encounters.
- With the entire list of Account Numbers copied, revert to the scorecard we were working on in Clinical Analytics.
- Enter the Profile Customizer by clicking the Profiles icon in the upper right corner of your screen, and then click +Add Profile.
- Name your profile something like "2015 HJR with Ephedirine" (this reminds us that this profile includes patients discharged in 2015 who had a hip joint replacement and received ephedrine) and make sure the Profile Type is Internal - Inpatient Encounter with Grouping Type APR-DRG.
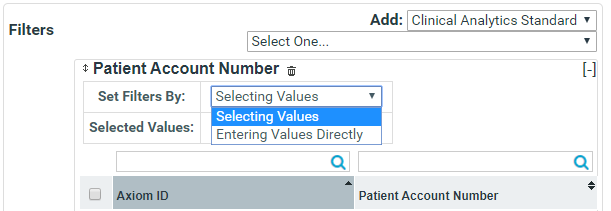
- Click Add Filter, and select Patient Account Number from the dropdown.
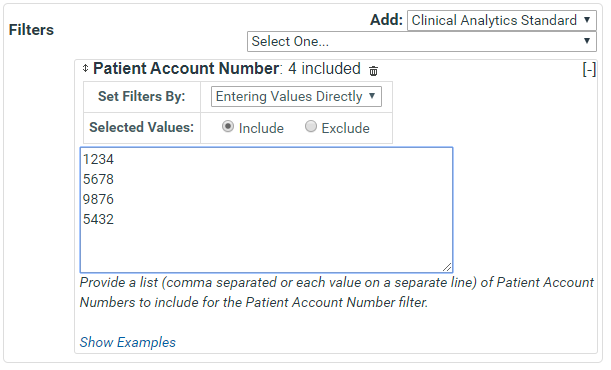
- Select the Set Filters By option: Entering Values Directly. This allows you to paste the list of account numbers instead of searching for and selecting them individually.
- Click within the white box, and paste the account numbers that were copied from the detail charge export in step 8c.
- Save the profile by clicking Save, and then click the green check mark to exit the Profile Manager.
- Let's take a look at some speedometers for key metrics that we would like to see for our focused patient population.
- Click the Speedometers tab, and enter Customizer mode by clicking the pencil icon.

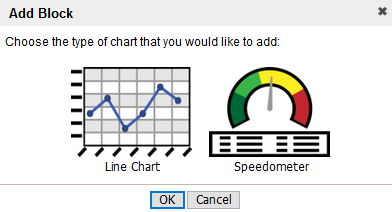
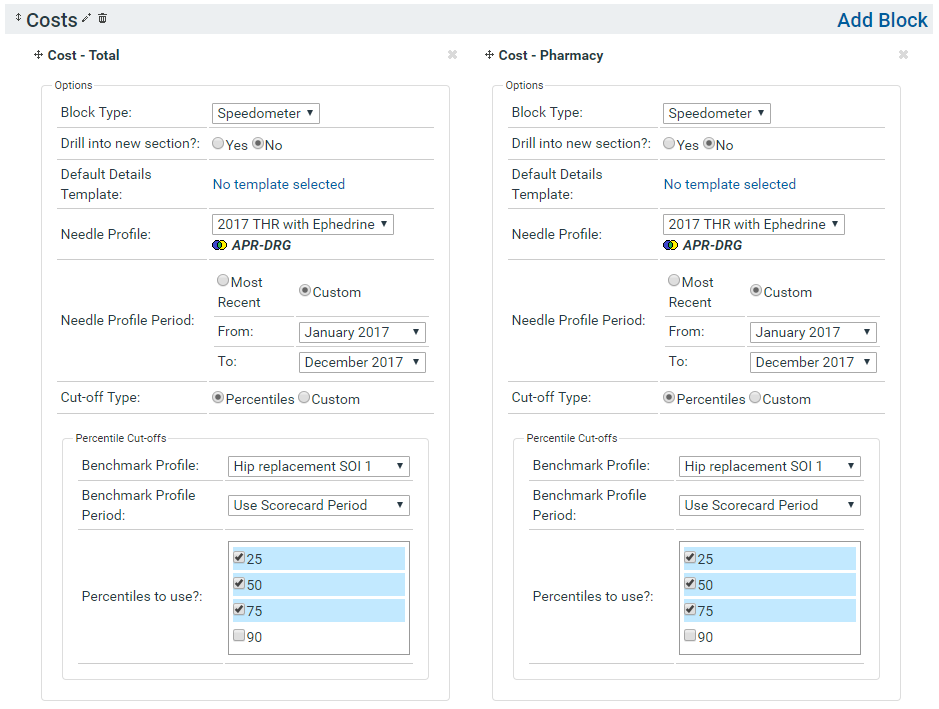
- In Customizer mode, click Add Block for the Two Column section.
- Select the speedometer icon, and then click OK.
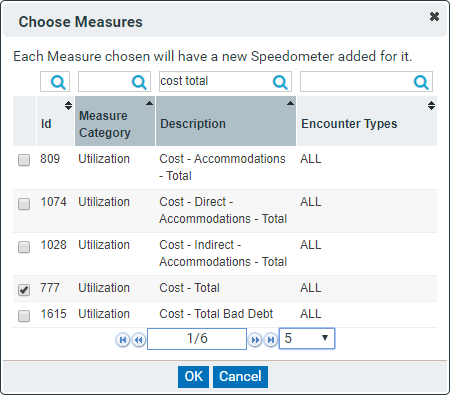
- Select the measure(s) that you would like to see a speedometer of (for example, Cost - Total and Cost - Pharmacy), and click OK.
- Select the appropriate Needle Profile for your population of interest (2015 THR with Ephedrine). Also select the desired benchmark profile for the speedometer (in this example, we select "Hip replacement SOI 1" so we are comparing total costs for patients receiving the drug Ephedrine against all hip replacement patients).
- Click the pencil icon next to the section name (New Section) and retitle the section "Costs."
- Click the green check mark to exit Customizer mode to see the speedometer just created.

- Click the Speedometers tab, and enter Customizer mode by clicking the pencil icon.
- From the speedometers created in this example, we find that, in general, there does not appear to be a large difference between the average costs (Total or Pharmacy) for patients with and without ephedrine.
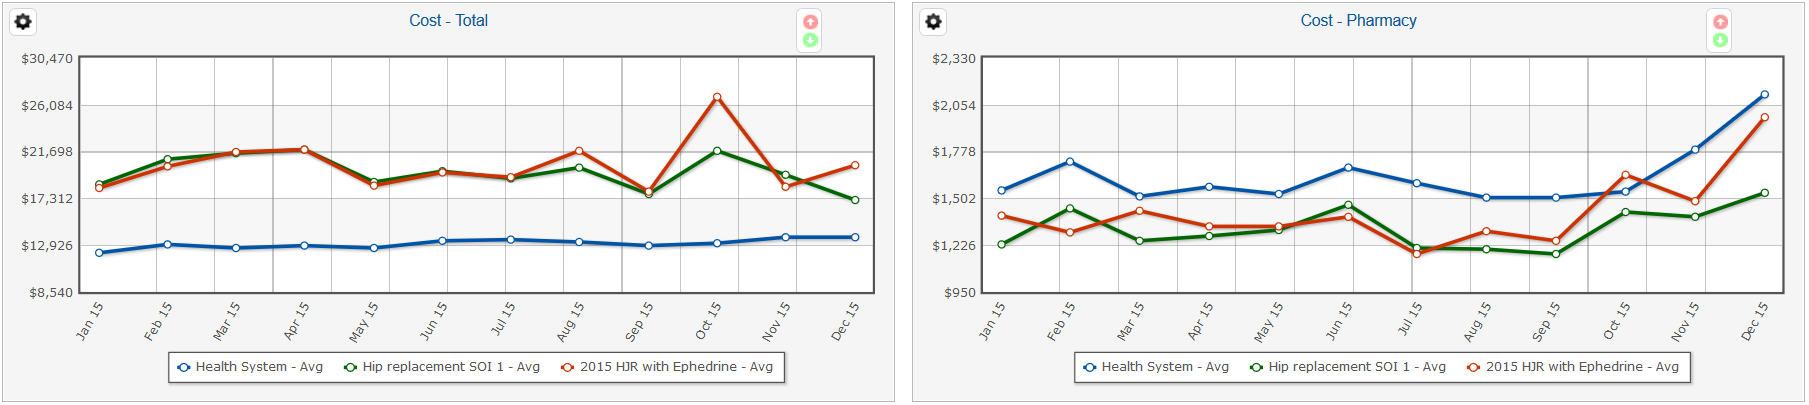
- We can repeat step 10 to add line charts for the same measures and see about the same story. Because we have a health system (all inpatient encounters) profile on our scorecard, we also have a line for the health system in our line chart.
- We can see that there is some strange behavior during the last quarter of the year; ICD-10 was released in October 2015, so we might investigate coding changes around this time to see how that might affect our cost measures.
- To see more definition between the two hip replacement profiles, we might edit the Hip replacement SOI 1 profile to exclude patients receiving ephedrine.
NOTE: When doing a Detail Charge Export, keep in mind that a large amount of data is exported to Excel for each patient, so you may find it helpful to use a small sample of patients (fewer than 1000). Consider a shorter time frame (for example, look at one month or one quarter instead of one year) to reduce the patient population.
NOTE: This section generates a table of data with one patient encounter on each row. This table includes only those patients who match the profile requirements and were discharged within the selected time period.
NOTE: The exported Excel file is very large. In contrast to the typical Excel export from Details Section, where each row represents a patient encounter, each row of the Detail Charges Excel export file represents one charge, so one patient’s encounter can occupy hundreds of rows of data.
NOTE: There are duplicates most of the time due to the same patient’s receiving the charge item more than once. Clinical Analytics automatically removes duplicates when you select profile attributes.
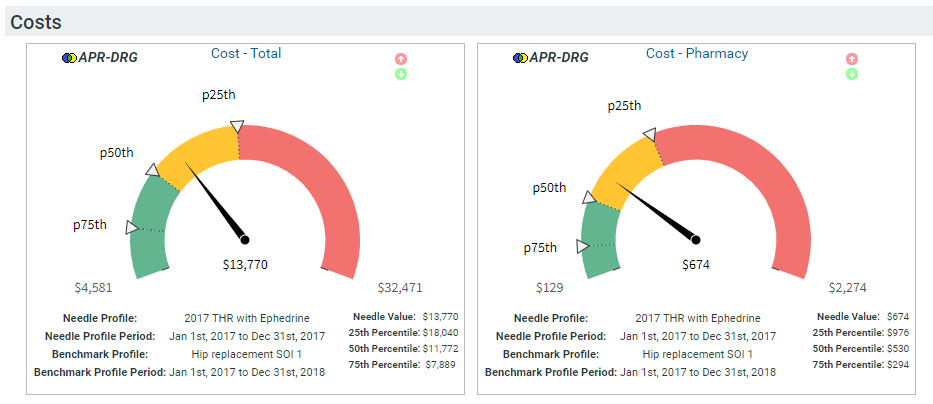
NOTE: From this analysis, we conclude that hip replacement patients receiving Ephedrine do not appear to have significantly different costs (total or pharmacy) from hip replacement patients overall.
Additional analysis
- Try using Excel (step 8) to identify and create a profile for the opposite grouping of patients (the ones who did not receive Ephedrine) and create side-by-side speedometers (step 10).
- Add other measures (step 10f) to see if ephedrine affects other patient outcomes (for example, length of stay, HACs, and so on).
- Try modifying time periods (step 4) and attempt to control for different variables in the analysis (that is, modify the profile or the Excel export).
- As you get more comfortable with the steps, try different populations of patients (step 2) and different drugs, supplies, or other charge items (step 8).
